Experiments with PageRank Computation
|
Ashraf Khalil |
Yong Liu |
1. Introduction: The idea and the purpose
PageRank algorithm is one of the most commonly used algorithms that determine the global importance of web pages. Due to the size of web graph which contains billions of nodes, computing a PageRank vector is very computational intensive and it may takes any time between months to hours depending on the efficiency of the algorithm. This promoted many researchers to propose techniques to enhance the PageRank algorithm [2-7, 11]. However, some aspects of PageRank algorithm are left unstudied. In this work we are investigating PageRank convergence as a function of the web graph, PageRank value versus order in addition to some other properties.
2. Review of PageRank
The PageRank concept was first introduced in [1] and it is the mechanism used in Google search engine. PageRank function assigns every web page a value that reflects the importance of such page. The documents that match a certain query are presented in a decreasing order of their PageRank value. In order to better understand the PageRank algorithm, we treat the web as a directed graph G = (V,E), where the set of V vertices of n pages, and the set E of directed edges (i,j), which exists only if there is a link from page i to page j.
The PageRank algorithm assigns a rank value ri for a page i as a function of the rank of the pages that point to it:
![]()
![]() (1)
(1)
Where di is the number of outgoing links of a page i. This recursive definition gives a page a fraction of the rank of each value pointing to it that is weighted by the out-degree number. In order to be able to numerically calculate the above equation it is important to guarantee it is convergence. Strongly connected graphs are guaranteed to converge and this is done by adding a new set of complete outgoing transitions with a small probability for all pages in the web graph. This leads to the following modified equation:
![]() (2)
(2)
Equation 2 can be rewritten in a matrix form to obtain the following equivalent equation:
![]() (3)
(3)
Where e is the vector of all 1’s, and A is the matrix where ![]() if there is a link between i and j and zero otherwise. Usually the value of c is taken to be 0.85 or
0.9. In addition it is very important to remove all rows and columns in the
matrix A with all zero entries. This corresponds to removing the pages with
zero out-degree called sink pages or dangling pages.
if there is a link between i and j and zero otherwise. Usually the value of c is taken to be 0.85 or
0.9. In addition it is very important to remove all rows and columns in the
matrix A with all zero entries. This corresponds to removing the pages with
zero out-degree called sink pages or dangling pages.
The intuition behind the above PageRank algorithm can be better understood with the random surfer model. The random surfer browses the web by going from one page to the next. Given the current location of the surfer, the successor location is a page that can be reached by following the link of from the current page uniformly at random. In addition if the case the surfer reaches a page without any out-going links, he jumps at random to any other page. The PageRank value for a page is the probability that at some time step the surfer is at that page.
3. Experimental Setup
The used both Stanford and
Stanford-Berkeley links graph that we obtained via personal contact with people
from Stanford WebBase project. Stanford link graph we
crawled in September 2002 and it contains around 282,000 pages.
Stanford-Berkeley link graph was crawled in December 2002 and it contains
around 683,000 unique pages. The sparsity representation of the
Stanford-Berkeley link graph is plotted in Figure 1, where the upper dense
square shows
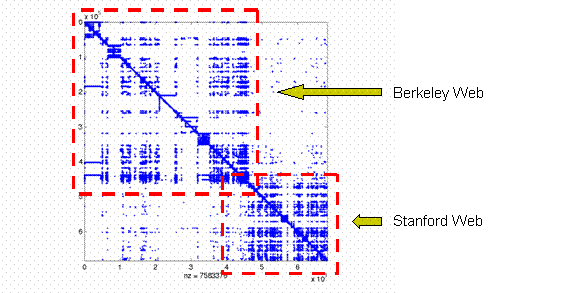
Figure 1: The graph shows the sparsity of the Stanford-Berkeley Link Graph
1. Results and Discussion
1. In-degree out-degree distributions
In this part we just plotted the in-degree and out-degree distribution for both the collected and simulated data. The idea is to investigate how our data collections conform to the well-known results for both the in-degree and out-degree distribution. Figure 2 and 3 are log-log plots for the in-degree and out-degree distributions for Stanford-Berkeley data respectively. Best fit line for figure 2 gives a power law with exponent of 2.1 while figure 3 gives and exponent of 2.4. These results are in a good agreement with previous research [10, 11, 12]. We also repeated the same experiment for Stanford data and we obtained very similar results.
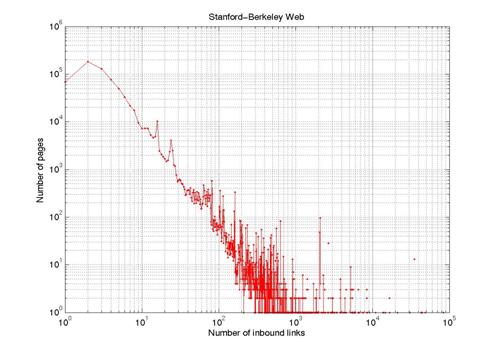
Figure 2: in-degree distribution
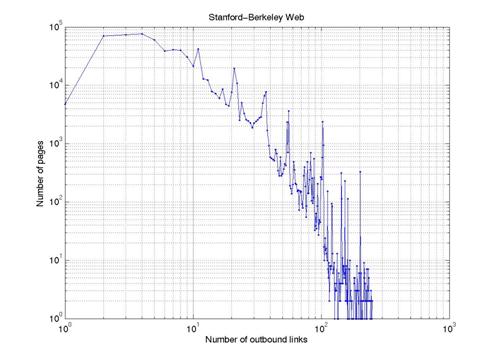
Figure 3: Out-degree distribution
2. PageRank value convergence as a function of the web size
Many topical crawlers use the PageRank techniques to prioritize the crawler frontier. By doing so, it is assumed that the PageRank values for the collected sites are a good approximation for the real values. This assumption is not limited to focused crawlers; general crawlers such as the Google one also assume the PageRank for their collection is a good approximation for the real values. By the real values for the PageRank we mean the values that obtained from the whole web. In this experiment we studied the validity of such assumption, i.e, is the PageRank vector for the partial collection a good approximation for the whole collection? How good or bad is the approximation? How does this approximation change as function of the web size?. To do that, we measured the PageRank vector for the complete matrix then we compared the difference of the PageRank values when we take part of the whole matrix. Figure 4 shows how PageRank values changes as a function of the link graph size. In this experiment we considered the real PageRank vector as the vector obtained when we use the whole link graph of our data collection. The y-axis is the ratio of the average PageRank(Z) values of first 1% of the whole vector to the average of the real PageRank values of the same data. We define the PageRank(Z) as the PageRank vector obtained when only Z% of the whole matrix size is considered.
From the figure we can see at when we calculate PageRank vector for 60% of the whole Stanford-Berkeley graph the average PageRank of the first 1% if the vector is double the real value of the PageRank. Only when PageRank is calculated for 90% and more of the whole link graph we obtain PageRank values close enough to the real PageRank values.
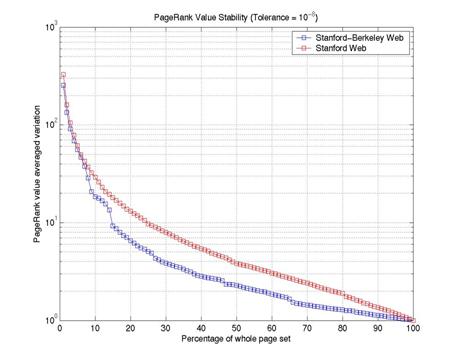
Figure 4: The average PageRank values for the first 1% as a function of the Link graph size
3. PageRank Convergence as a Function of the Web Size
The convergence speed of the PageRank vector depends on many factors. It depends on numerical solver, the random jump probability value and the size of the matrix. In this experiment, we tried to measure the effect of the matrix size of the convergence speed. Figure 5 shows the results of PageRank convergence as a function of the size of the web graph. The figure shows the smaller the web graph the faster it converges. Figure 6 shows PageRank converge with different values of C parameter (from equation 3). From the figure we can see that the closer the C value to 1 the slower the convergence is. This is due to the reason that the convergence speed depends on the difference between the first and the second Eigenvalues which in turns depends on the C value [4].
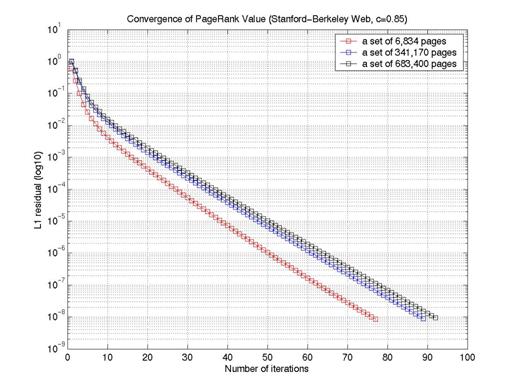
Figure 5: PageRank convergence as a function of the size of the web graph
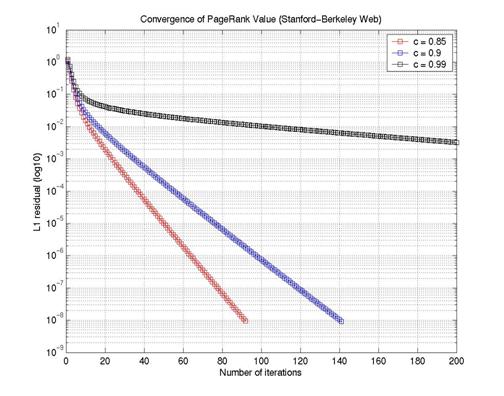
Figure 6: PageRank convergence as a
function of C
4. PageRank order versus values
The idea behind calculating the
PageRank vector is to order the sites according to their importance reflected
by the corresponding PageRank value. The absolute values themselves are
meaningless and what is important is the relative
values that convey the order. For that reason, the real interesting convergence
of PageRank vector is when all entries of the vector are ordered in the right
place within that vector not when we reach the value convergence. The question
arise when does the order converge? Does it converge long before the values
converge or around the same time? This is corresponding to answering the
question of what is the minimum tolerance (L1 norm) value we can use to test
for convergence. If the order converges at an early stage of the computation
then we can stop there and save valuable time. In order to measure the order we
are using The

Figure 7 shows the plot of
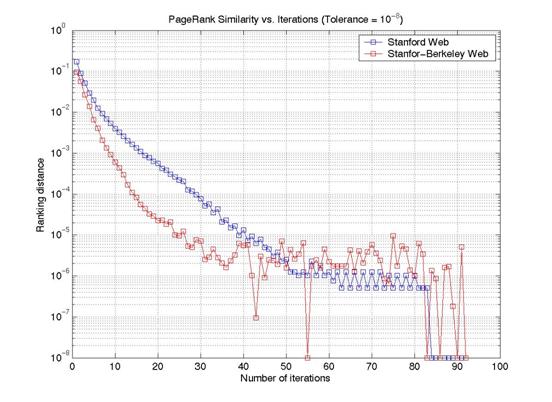
Figure 7: PageRank Order distance
2. Conclusion
The main conclusion of these experiments is that, using the ordering distance to check for PageRank convergence is better than using L1 norm which is most commonly used. Ordering Distance provides us with the value at which the PageRank vector reaches a stable ordering that hardly changes as we continue the computation.
For future work we are planning to use larger data (from Stanford WebBase) collection to validate our previous conclusion. In addition we are investigating using iterative numerical solvers to compare it with the speed of the power method which is the traditional one used to solve for PageRank vector.
3. References
1.
L.
Page, S. Brin, R. Motwani,
and T. Winograd. The PageRank citation ranking:
Bringing order to the Web. Stanford Digital Library Technologies, Working
Paper, 1998.
2.
Taher Haveliwala, Sepandar
Kamvar, Dan Klein, Christopher Manning, and Gene Golub. "Computing PageRank
using Power Extrapolation," Stanford University Technical
Report, July 2003.
3.
Sepandar D. Kamvar, Taher
H. Haveliwala, and Gene H. Golub,
"Adaptive Methods for the Computation of PageRank", In Linear Algebra
and its Applications, Special Issue on the Numerical Solution of Markov Chains,
November, 2003.
4.
Taher H. Haveliwala and Sepandar
D. Kamvar "The Second Eigenvalue of the Google Matrix,"
5.
Sepandar D. Kamvar, Taher
H. Haveliwala, Christopher D. Manning, and Gene H. Golub. "Extrapolation
Methods for Accelerating PageRank Computations," In Proceedings
of the Twelfth International World Wide Web Conference, May 2003.
6.
Taher Haveliwala. "Topic-Sensitive
PageRank," In Proceedings of the Eleventh International World
Wide Web Conference, May 2002.
7.
Taher Haveliwala. "Efficient
Computation of PageRank,"
8.
R.
Kumar, P. Raghavan, S. Rajagopalan,
S. D., A. Tomkins, and E. Upfal.
Stochastic models for the web graphs. In Proc. 41st Symposium on Foundations of
Computer Science (FOCS), pages 57--65. IEEE, 2000.
9.
G. Pandurangan, P. Raghavan, and E. Upfal. Using PageRank to Characterize Web Structure,
Proceedings of the 8th International Computing and Combinatorics
Conference (COCOON), 2002.
10. S.R. Kumar, P. Raghavan,
S. Rajagopalan, D. Sivakumar,
A. Tomkins, and Eli Upfal, The Web as a graph.
Proceedings of the 19th ACM Symposium on Principles of Database Systems, pp
1-10, 2000.
11. Andrei Broder, Ravi Kumar, Farzin Maghoul, Prabhakar Raghavan, Sridhar Rajagopalan, Raymie Stata, Andrew Tomkins, Janet Wiener, Graph structure in the web:
experiments and models, WWW9.
12. R. Albert, H. Jeong,
and A.-L. Barabasi. Diameter of the World Wide Web.
Nature 401:130{131, 1999.
13. Ronald Fagin,